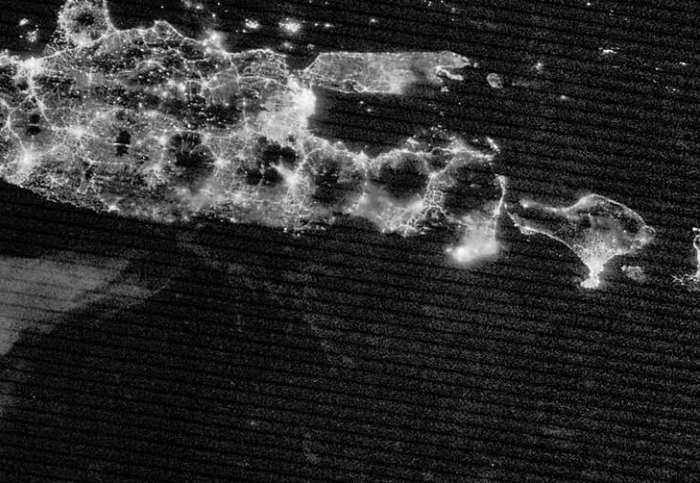
What would you think if you sailed into a vast area of ocean that glowed in the dark with pale white light? One sea captain, Raphael Semmes, was traveling along the Horn of Africa in 1864 when he encountered this phenomenon. “We suddenly passed from the deep blue water in which we had been sailing, into a patch of water so white that it startled me,” he wrote. His ship was “lighted up by the sickly and unearthly glare of a phantom sea. ”
For a long time, all people knew about this rare event, nicknamed “milky seas,” came from sailor’s stories. Steven Miller is an atmospheric scientist at Colorado State University who works with satellite data. He wondered if satellites might have captured images of milky seas. But their glow is dim and difficult to see in satellite images. “No one had been looking for them,” Miller said. “It wasn’t something that would stand out in normal imagery. ” But he thought a sensor detect the Day/Night Band probably could have captured it. This sensor is unique in its ability to detect very faint visible light at night.
After a thorough search through images taken between 2012 and 2021, Miller and colleagues found twelve examples of what they thought were milky seas. One of them had occurred off the coast of Java in 2019. To Miller’s delight, sailors who had been in the area at the time had snapped photos of their experience, confirming the satellite’s sighting.
Scientists think that some marine bacteria have a trait called bioluminescence, cause milky seas. But scientists know very little about how and why such vast areas light up all at once. Now that satellites can observe and measure the phenomenon, Miller says, it’s possible to “begin the scientific journey of understanding what might be causing milky seas to form. ”
Earth-observing satellites have many sensors and other instruments for gathering all kinds of interesting data. And satellites are just one of many tools that scientists use to gather information about the planet we call home. It may seem like a lot of work to make all these measurements, but it leads to important knowledge about Earth and its secrets, like those bizarre milky seas. Let’s take a tour of the many aspects of Earth’s seas and lands that experts regularly measure.
Observing the Oceans
Scientists observe many aspects of the ocean. They measure its appearance, its temperature, and the movement of its currents. They also measure what’s mixed in the water, including its salt content, oxygen content, pH (how acidic the water is), and the levels of nutrients and other key substances such as carbon dioxide. They even measure water’s conductivity. Scientists detect and track the living things and ecosystems of the ocean. They map the depth and topography of the sea floor. Plus they collect information about underwater volcanoes and seismic activity, to detect the occurrence of earthquakes. A variety of tools help collect all this information.
Spying with Satellites
Over one thousand Earth-observing satellites look at the planet from space, and their number is only growing. Many different countries and organizations around the world control these satellites.

Geostationary satellites orbit in synch with Earth rotation, at an altitude of 22,236 miles (35,786 km). They remain over the same point on the surface. These may weigh several tons and typically carry a diverse array of instruments.

Low-Earth Orbit (LEO) satellites zip around the planet from a closer distance of 2,000 km or less. These usually come in fleets of very small satellites that work together to gather data about the planet.An Earth imaging company called Planet Labs manages a fleet of three hundred LEO satellites that observe Earth. Each one is just 5.4kg and about the size of a loaf of bread. In addition, medium orbit and elliptical orbit satellites also exist, but they are less common.
All these satellites “sense the Earth from afar,” says Miller. “They’re not touching the planet. Instead, they’re detecting its reflected light. ” Visible light includes all the colors people can see with their eyes. In the ocean and freshwater, blooms of algae change the color of the surface of the water. says Miller. Algal blooms can be harmful, but they can also attract fish that people want to harvest. Satellite images make it easier to notice these blooms forming and predict how they will move and change over time.
Visible imagery can also help track sea ice and icebergs. Miller says he will look at satellite images and see “these strange blocks of bright whiteness that are drifting along in places where you might not expect them to be—having traveled hundreds or even thousands of kilometers away from their source. ” They are huge chunks of glaciers that have broken off due to melting.
Taking theSea’s Temperature
There are other kinds of light that people can’t see—but satellites can. “Some instruments are sensitive to the thermal or the heat energy that is emitted by the Earth,” says Miller. The Visible Infrared Imaging Radiometer Suite (VIIRS) instrument on the Suomi National Polar-orbiting Partnership (Suomi NPP) satellite is commonly used to measure land and sea surface temperatures as well as the temperature at different heights above sea level in the atmosphere. Heat sensors can even estimate the height of clouds based on their temperature.

By observing ocean temperatures, we gain an understanding of events in the seas. The temperature at the ocean’s surface can reveal how water is moving. For example, in an upswelling, cold water rises up from the deep ocean, so cold temperatures may indicate an upswelling. Ocean temperatures also affect the survival and movements of ocean animals. For example, high ocean temperatures can kill corals through a process known as bleaching. Satellite data help track and predict sea temperatures, but the most precise measurements come from ships and sensing buoys.
Lidar and Radar
Color and temperature data are collected passively as a sensor captures light radiating from Earth. Lidar and radar instruments are different. They do active observation. Lidar sends out laser pulses of near-infrared, visible, or UV light, while radar transmits radio waves. Both lidar and radar are “sending out a pulse of information, then waiting for it to return,” explains Miller. “The time that it takes to return tells us how far away the object reflecting that energy was. And the amount of radiation that returns has to do with how reflective that object was—which is related to its size and composition. ”
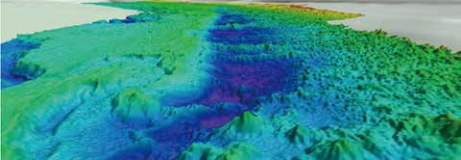
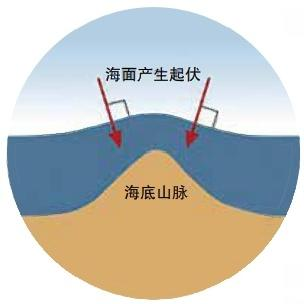
Lidar and radar are both very important parts of weather prediction. Lidar can map the vertical structure of clouds to determine whether it might rain or snow. For example, thick dark clouds indicate storms. They both also help us observe the ocean. A satellite radar altimeter is an instrument mounted on a satellite that detects altitude by sending radar pulses to the surface of the ocean and then receiving them. Scientists use this information to track sea level rise, one of the problematic effects of climate change. Radar altimeter data is also used for bathymetry, a technique for mapping the sea floor. This works because mountains and valleys in the sea floor exert different gravitational forces that make bumps and dips in the shape of the surface of the ocean above them.

Ships, Robots, and Observatories
Satellite bathymetry has mapped the overall structure of the sea floor. But this map only captures very large structures. Small dips, hills, crags, and complex underwater topography can’t be detected this way. As of 2017, just 6 percent of the ocean floor had been mapped in detail. But researchers have been hard at work filling in the details. As of 2023, these maps were 25 percent complete.
To make detailed observations of the sea floor, researchers go out on ships or send out robots. Autonomous underwater vehicles (AUVs) are ocean robots that drive freely through the water. Remotely operated vehicles (ROVs) stay tethered to a ship while an operator guides them.
The best tool for detailed sea floor mapping is sonar. This is an active measurement that sends sound waves down to the sea floor and measures the signals that bounce back. Multibeam sonar uses an array of pulses in a fan-shaped pattern. As with lidar and radar, the time it takes for these signals to return is measured, it indicates the distance to the sea floor. And the intensity of the signals can reveal what’s down there. For example, a rocky bottom will reflect more sound than a soft, muddy bottom.
Ocean observatories also collect information about the oceans. The Ocean Observatories Initiative (OOI) , proposed by the United States, has five separate arrays of instruments placed in different locations around the globe. Some are coastal and others are moored out in the open ocean Fixed instruments either float with the help of buoys on the sea surface, hang in the middle of the ocean on mooring cables, or sit on the seafloor inside boxes. Other instruments get carried along cables through the water on moving vehicles called profilers.

In total, OOI manages more than nine hundred instruments of seventy- five different types. There are cameras that capture photos and video of sea life and undersea structures as well as hydrophones that capture sound. Sensors track every aspect of the ocean imaginable, from oxygen level to seismic activity on the sea floor. Some instruments even collect DNA from microbes in the water.

Ocean temperature is one of the many important things that these observatories help track. Data for maps of ocean temperatures mainly come from networks of buoys floating on the surface and using thermometers to track temperature. Ships traveling across the ocean also help measure temperature and collect other scientific data. Recently, some researchers have revisited an old idea that involves using sound waves to measure temperature. Sound moves more quickly through warmer water, so the time it takes for sound to travel through water can provide a temperature measurement.
Looking at the Land
Many of the same measurements that matter in the ocean—measure visual appearance, temperature, and seismic activity—also matter to those who study Earth’s land. Researchers also care about what’s below our feet. They observe the density of the ground and its composition as well as variations in Earth’s shape and gravity. Once again, a variety of tools and instruments help capture all this information.
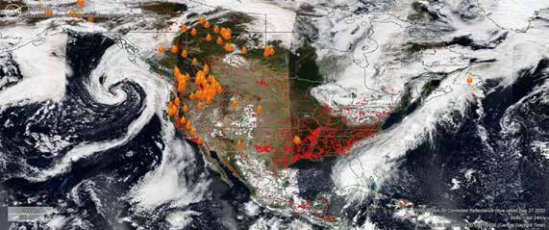
Satellites observe land’s appearance and temperature. This can help researchers track population densities of people and animals, the paths of wildfires, and more. The EOS-SAT constellation of LEO satellites, which began launching in 2023, is helping farmers to manage pests, weeds,water stress, extreme heat or cold, and other issues that may affect their crops.
Earth as a Whole
Geodesy is the name for a field of science that measures Earth’s shape, gravity, and orientation in the solar system. People usually draw Earth as a sphere, but the planet actually has an irregular shape called a geoid. As we mentioned above, the topography of the seafloor changes the gravity exerted on different parts of the ocean’s surface, with craters appearing where the gravity is weak and bulges appearing where the gravity is strong. The geoid extends this concept to the land, it is the plane of gravitational equilibrium with the surface of the sea, in which gravity is everywhere equal. It can also be described as the hypothetical shape of the Earth’s surface when it is completely covered by the oceans.
Geodesy establishes the precise location of points all over Earth’s surface. In the US, the National Spatial Reference System manages a network of over 1.5 million points. The points are usually marked with metal disks or rods. For each point, surveyors carefully measure latitude (how far north or south it is from the equator) and longitude (how far east or west it is from the meridian that goes through Greenwich, England). In addition, surveyors measure the point’s height (how far above or below sea level it is) and the precise pull of Earth’s gravity at that location. These points define the latitude, longitude, height, scale, gravity, and orientation.
A network of geodetic points allows all types of maps to agree with each other. Researchers also track geodetic information over time to measure changes in Earth’s surface. For example, as land sinks, the height of measured points in the area will drop.

Satellites often assist with gathering geodetic information. Some are part of a GPS (global positioning system) network. This system makes it possible for anyone on Earth to track someone’s or something’s location with great precision. Satellites also perform a measurement called gravimetry. Gravimetry just means measuring the precise pull of gravity at different points on Earth’s surface. It helps determine Earth’s geoid as well as the height of actual points on the surface of the land or sea.

One of the ways Satellite gravimetry involves two satellites that follow each other in orbit, both of them detect the Earth’s gravitational field. The amount of mass directly beneath one satellite affects its speed. As the first satellite approaches a mountain range, the additional mass means more gravity tugging on the satellite, which will pull it ahead by a very tiny amount, the distance between the two satellites will increase. After the first satellite passes over the mountain range, gravity will tug it back at the same time as the second satellite is getting tugged forward, shrinking the distance between them. So measuring the changes in distance between the satellites as they travel around Earth can reveal the shape of the planet below.
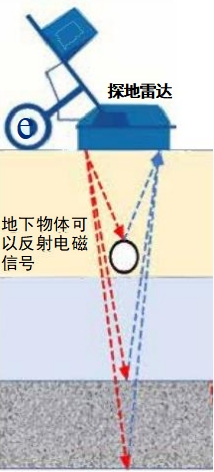
Revealing the Underground
Gravimetry helps map sea level and elevation. It can also reveal where ice has been lost and variations in the density of rock below the land’s surface. This can help researchers determine where different types of ores may be located.
Ground-penetrating radar is an instrument that can also reveal what’s underground. This type of radar sends out electromagnetic radiation in the microwave band and measures what happens to the radiation as they travel through the ground, allowing users to determine what is under them without digging.
Seismic monitoring stations use several different kinds of sensors to track movements and changes in Earth’s crust. Geophones measure vibrations in the ground. Different types of geophones are more sensitive to different rates of vibration. Accelerometers, on the other hand, measure how rapidly a point on the Earth’s surface moves as the ground shakes. They are important in determining when and where earthquakes might occur.

Putting it allTogether
As researchers collect information about the planet’s seas, lands, and more, they often put it all together using maps. Geographic Information Systems (GIS) is an approach that uses maps to help people better understand Earth observation data. Any kind of information that is connected to specific locations on Earth’s surface can be recorded in a GIS. National Aeronautics and Space Administration (NASA) has GIS maps of flooding, drought, agriculture, population density, and more. There’s even an official GIS day, November 15, when anyone can celebrate how well we’re now able to understand all of Earth’s interconnected systems.
Of course, there’s always more to observe. Researchers are always looking to gather information in greater detail. This includes vertical detail, capturing more about the atmosphere extending above Earth, as well as horizontal detail of smaller features on land and in the sea. Miller notes that getting down to finer spatial scales also requires working with shorter time scales. “Things are happening quickly in that on that fine spatial scale,” he says. Instruments that capture visual or temperature information every few meters would need to collect new info every few seconds, while instruments zoomed out to a broader scale may only need to update their data every few hours.
The more ways we observe Earth, the more we can discover, including explanations for mysteries such as milky seas. Earth observation also matters for our health, happiness, and livelihoods, notes Miller. “We probe the planet with our sensors and we observe its changes. We try to learn how everything is connected together. Realizing this is a big interconnected system helps us become better stewards of our planet. ”


